Immitracker vs. IRCC: Canadian Immigration Processing Time Insights, 2025 Year in Review
Since 2022, Immitracker has been collecting insights and crunching the numbers on application processing times for some of Canada’s most popular immigration programs. Thanks to our users, who have inputted their personal timelines, experiences, and case details, we’ve been able to extract key trends and paint a clear picture of what application processing actually looks like!
For each visa type, immigration program and citizenship, the IRCC provides average application processing time estimates. These official estimates by program can be found here. From the cases that get logged in the Canadian trackers on Immitracker, we noticed that reality can vary significantly from what is presented by the IRCC.
This annual report is a special edition that dives into all of the 2025 data we collected and maps out the processing time trends we witnessed throughout the year in comparison with the IRCC.
The programs that Immitracker reviewed are from the most popular trackers and include:
Spousal Sponsorship (Inland & Outland)
Additionally, for this special edition report, we included the annual overview of the application processing time trends for the following visa trackers:
Key Report Takeaways
The following are some of the most interesting observations based on our 2025 data:
We noticed that across two Express Entry programs, there was a correlation between faster processing periods and large invitation cohorts issues earlier in the year.
The fastest quarter for FSW (Q4, 2.3 months) was predominantly made up of French-language and Healthcare applicants from large August invitation rounds.
The official Q4 average we have for FSW is 6.8 months because one outlier case from 2021 took over 4.5 years to process. This made the processing times look more similar to the IRCC official ones but in reality, on average, FSW was significantly faster than what the IRCC was estimating in 2025.
CEC’s fastest month (September, 3 months) is majorly consistent with large CEC draws from May to July 2025. The month with the largest amount of approvals (January) also closely aligned with large invitation cohorts from earlier in the year (in 2024).
Across all three Express Entry programs we analyzed (CEC, PNP, FSW), we noticed a significant reduction in case approvals on Immitracker towards the end of the year - November and December specifically.
This pattern compliments our second finding nicely - months with the highest volume of approval for both FSW and CEC was January.
Based on our findings, IRCC significantly reduces EE application approvals towards the end of the year and then radically increases them again at the start of the next year (specifically in January).
Category-based prioritization played a significant role in 2025, particularly for French-language applicants under the FSW program. We noted that many Francophone draws occurred throughout the year, and tracked French program approvals proportional to those draws on our end. This particular group consistently appeared in the fastest processing and high-volume approval months.
The average processing time for FSW cases on Immitracker in 2025 was 152 days (5.1 months). The average for French-language applicants on Immitracker in 2025 was 90 days (3 months).
French-language was the fastest processed category among FSW applicants last year, followed very closely by Trades at 91 days.
The most popular province in all of our data for PNP applicants in 2025 was found to be Ontario. Ontario accounted for the largest share of applicants at 43% of all recorded PNP Express Entry cases.
Outliers overall had a significant impact on reported averages, especially in months with low case volumes. Extreme cases (e.g., 700+ or 1,000+ days) significantly skewed monthly processing times, making some months appear slower than they actually were.
Under the Federal Skilled Worker program, we tracked two major outlier cases that occurred within the months of August and October. These cases skewed the average of this program for 2025 to 5 months, when without these cases, the true average processing time would’ve been closer to 3 months.
Across three programs, processing times reported by applicants were often faster than IRCC’s estimates for 2025. This trend was apparent in Citizenship, as well as both Inland and Outland Spousal Sponsorships and the FSW program.
In these three particular trackers, the average timelines consistently remained faster than government estimates for most of the year.
CEC timelines differed slightly as the average was closely aligned with IRCC estimates in the first half of the year, before speeding up in the second half.
PNP showcased a more mixed pattern, with Immitracker’s reported average being initially slower than the government timelines, but it became faster in the second half of the year.
One pattern we’ve noticed in the data is that several of the longest cases across programs such as PNP and CEC in particular, are more often associated with Chinese and Iranian nationals.
Some PNP cases involving Iranian applicants took as long as 629 days in Q2 to process. A couple more cases came up in Q3 at 547 and 457 days.
This might reflect some external factors such as additional processing screenings or requirements.
A small number of STEM category cases (3) approved in January trace back primarily to April 2024 invitation rounds (draw referenced in Figure 1 below).
An additional 3 STEM category cases got approved later in 2025 and they trace back to a December 2023 draw.
While the sample size is small, this finding could suggest that STEM-related draw applicants may have experienced longer or less consistent processing timelines.

Figure 1. ITA cohort associated with STEM cases approved in January 2025 (CEC)
Average Processing Times Overview for 2025
This graph below summarizes and compares the government processing time estimates for each of the programs in the left columns with the actual processing time estimates calculated by Immitracker on the right side.
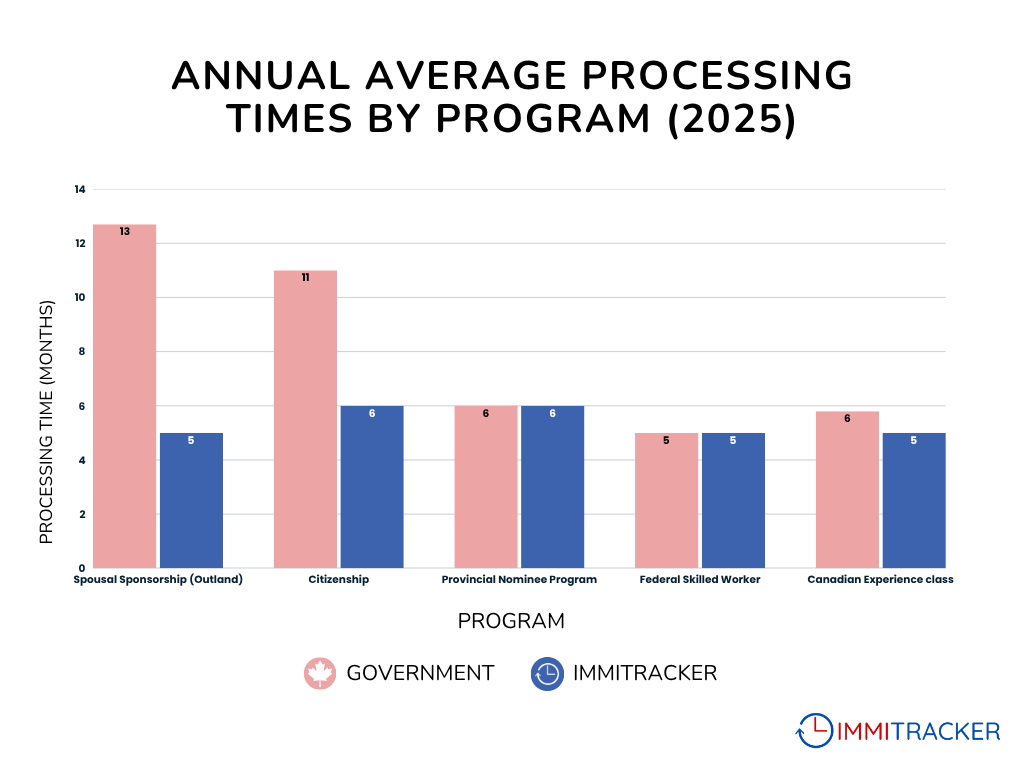
The government estimates were collected approximately every quarter from the IRCC website and averaged out for the entire year. The Immitracker numbers were calculated based on the cases that successfully finished processing over 2025. Case timelines were counted from application submission to final approval.
This graph below compares the slowest and fastest Immitracker cases by processing times broken down by program. The goal was to show just how wide the processing time range can be, from shortest to longest case. For some programs (such as FSW and CEC) the discrepancy was huge!
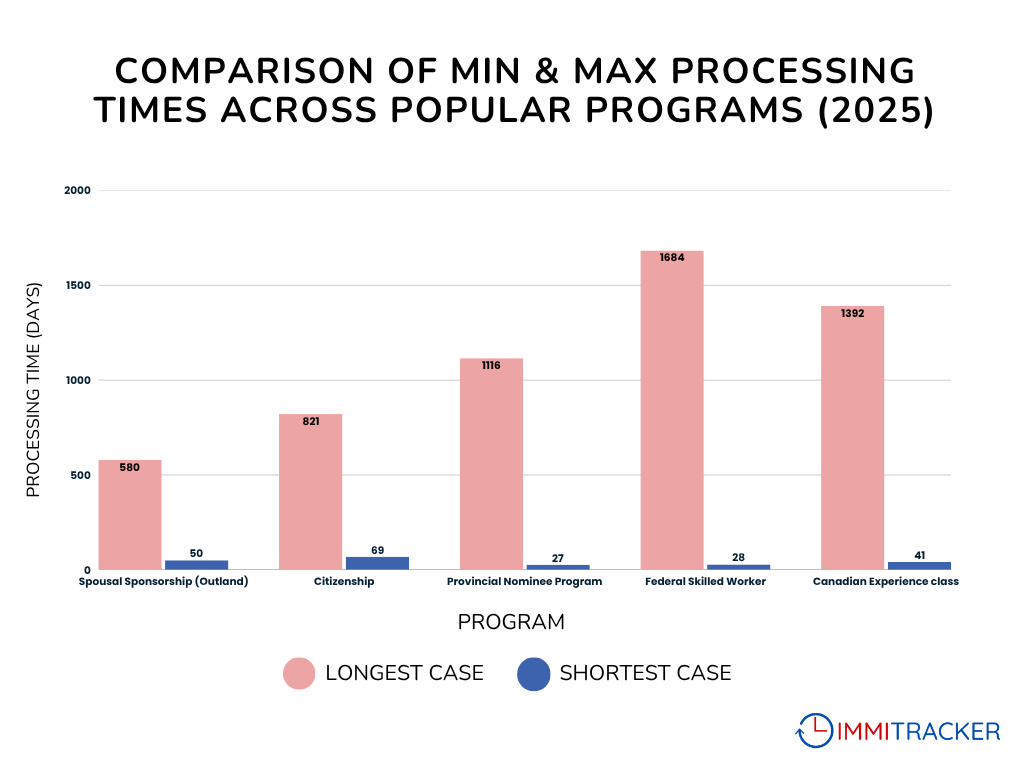
Left columns - slowest cases, right columns - quickest cases. Breakdown by program.
2025 Processing Time Trends by Program
In the sections below, we break down our Immitracker processing time insights for each individual program by conducting a month-to-month comparison between our data and the IRCC averages.
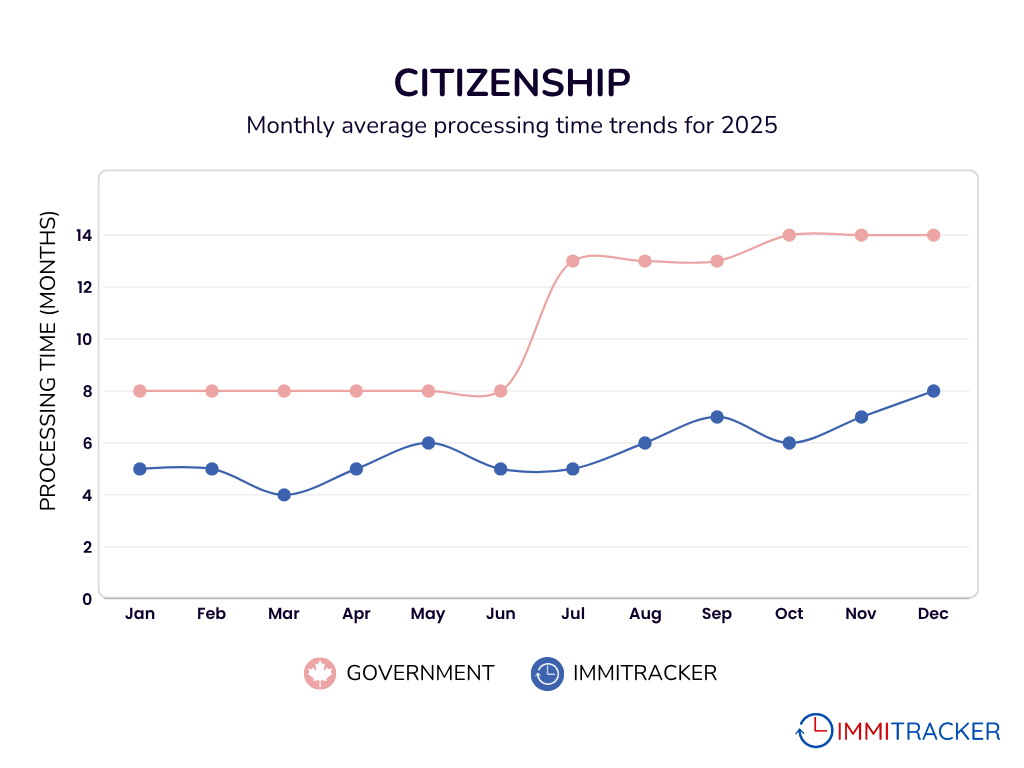
Citizenship
This past year, the IRCC has consistently reported longer Citizenship application times than what the actual user data was showing us. On average, Immitracker found that Citizenship took 6 (5.6 to be exact) months in 2025, while the IRCC estimated 11 months.
In the first half of 2025, IRCC’s average was nearly double the case averages we observed. However, starting in August, both sources displayed an upward trend; IRCC’s estimate grew to 14 months while Immitracker’s data increased to almost 8 months! Processing times mostly grew steadily beginning around July for both sources.
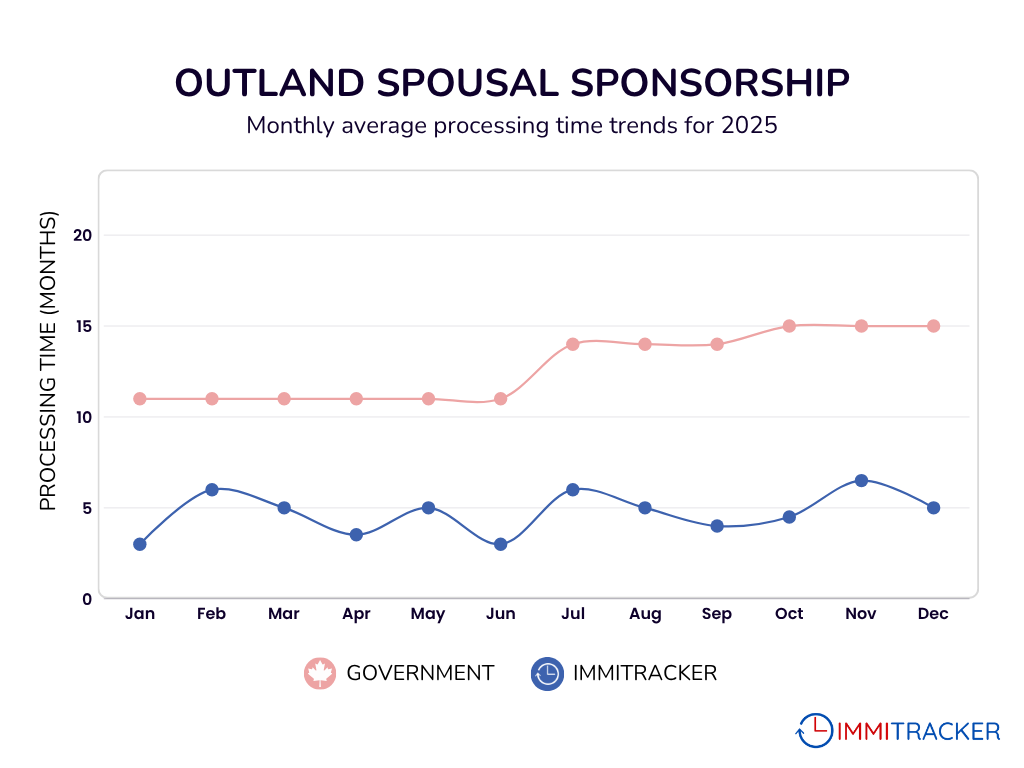
Outland Spousal Sponsorship
Although Spousal Sponsorship estimates are broken down into two buckets on the IRCC website (Inland and Outland), we noticed that outside of the highs in February, July and November, this program was being processed much faster than expected. Immitracker found that for Outland Spousal Sponsorship, the 2025 average came out to 5 months versus the IRCC estimate of 13 months.
Particularly in Q4, we can see a slight increase in application processing times which falls in line with government averages that indicate an upwards trend.
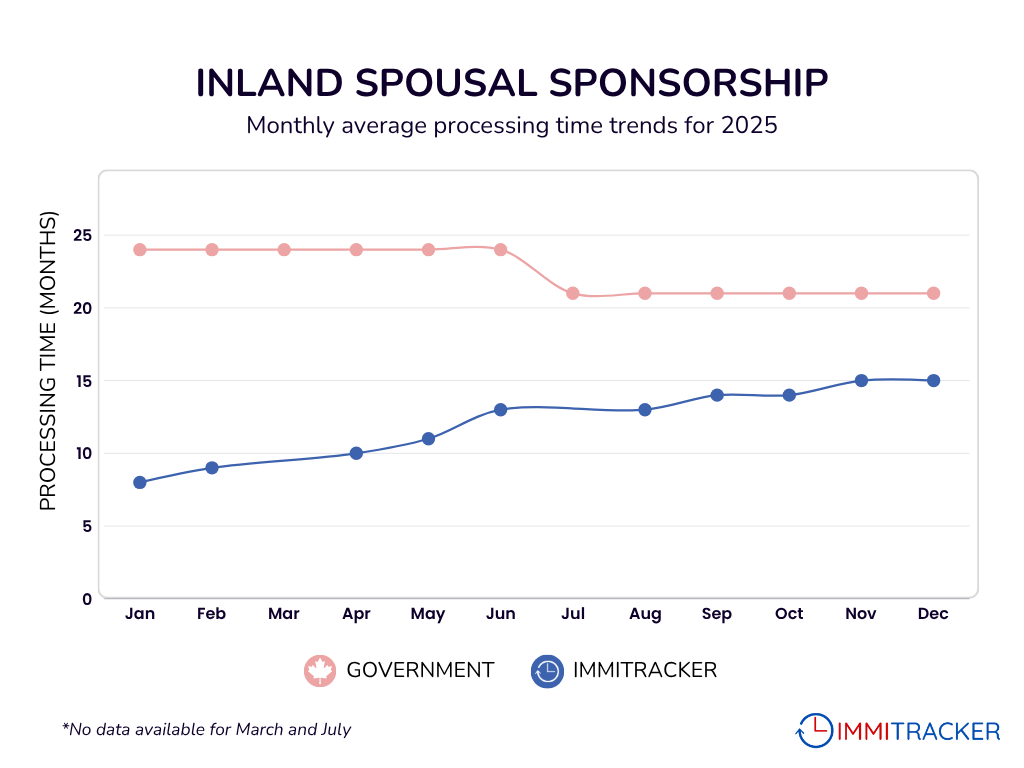
Inland Spousal Sponsorship
For most of the year, Inland spousal sponsorship applicants reported significantly faster average processing times through Immitracker when compared to IRCC’s estimates. On average, we found that the Inland Spousal Sponsorship program took 13 months in 2025, compared to IRCC’s average estimate of 23 months. When compared to outland cases, inland applications still seemed to take considerably longer, requiring almost twice as much time.
At the halfway point of the year, while IRCC’s estimated processing times decreased, Immitracker data showed a gradual increase. Despite this, there is little variation across monthly averages, with most values differing by one month at most. The two trends between Immitracker’s data and the government’s estimates appear to converge closer towards the end of the year.
Also, a comparison with spousal work permit data indicates that average processing times remained around five months, which may pose a challenge for Inland applicants who rely on authorization in order to work. Delays in work permit processing could therefore negatively impact applicants’ ability to work during the sponsorship period.
It is also important to note that no Immitracker cases were recorded for March and July, which may prevent us from being able to fully observe trends for the year.
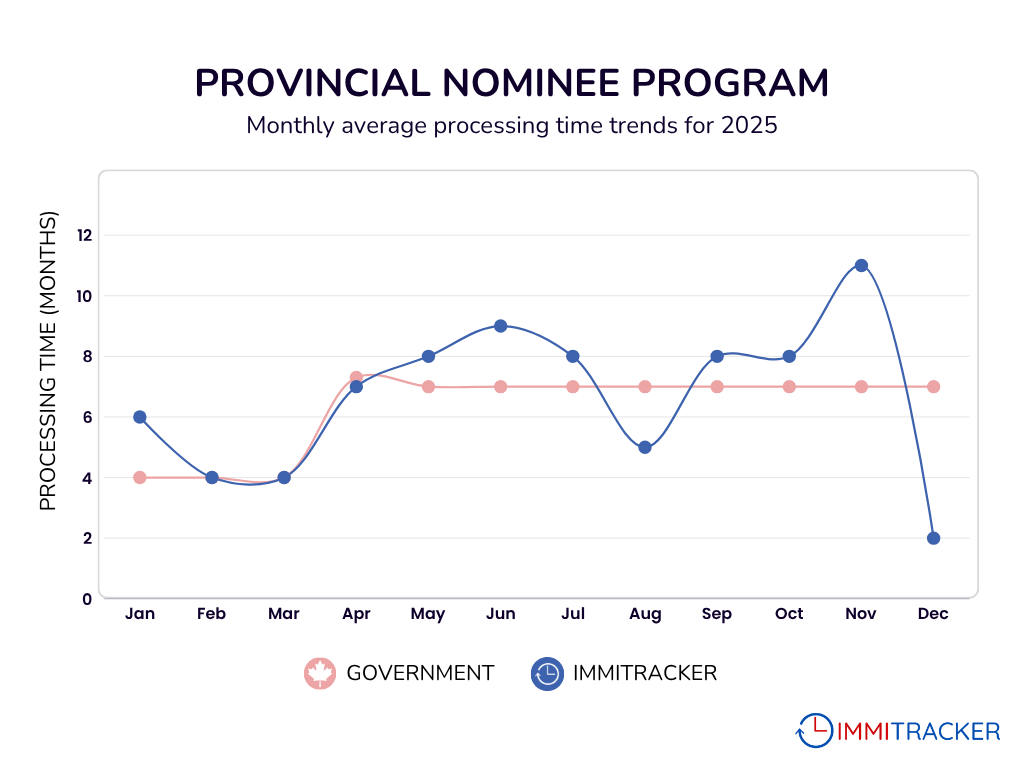
Express Entry Provincial Nominee Programs (PNPs)
The government began the year with estimates suggesting shorter average processing times for the Provincial Nominee Program. On average, for this program, Immitracker found the processing time to be 6 (6.1 to be exact) months for 2025, while IRCC estimated 6 months as well.
However, processing times increased significantly from April to June, reaching a peak during this period.
Overall, while processing times fluctuated considerably throughout the year, they were generally aligned with government estimates, with some notable deviations in the later months such as November and December.
It is important to note that we analyzed very few cases for Express Entry PNP during November and December which significantly affected our processing time estimates. It looks like less cases on Immitracker were approved for this program towards the end of the year.
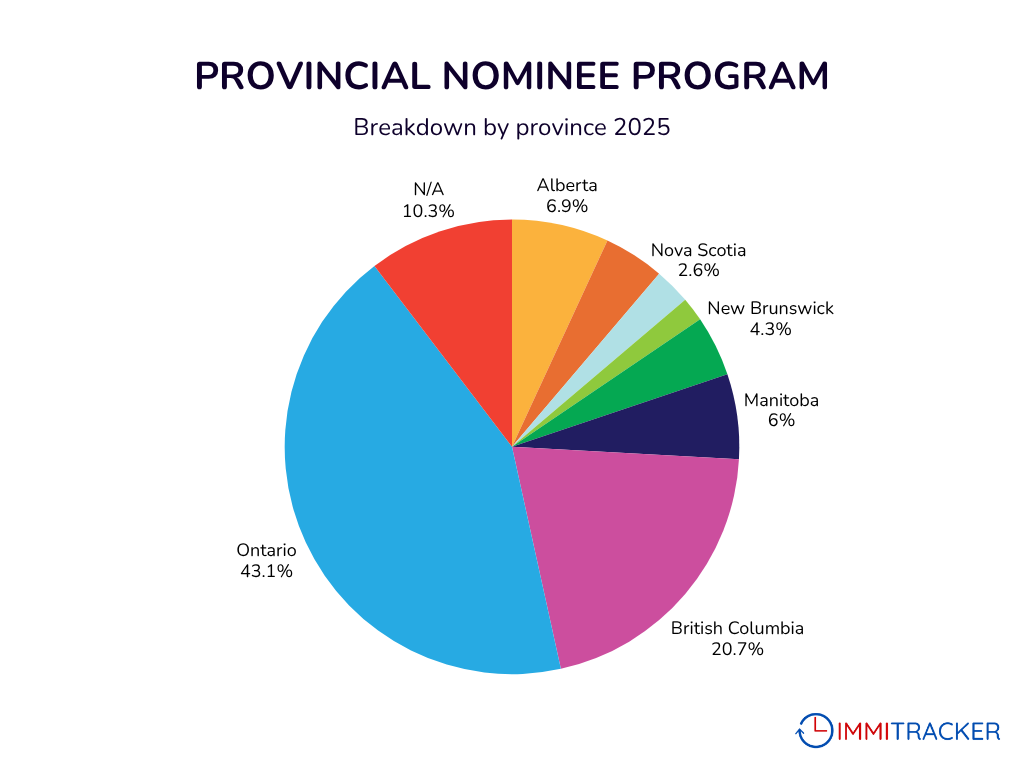
Breakdown by Province (for PNPs)
When taking a closer look at provincial distribution, Ontario accounts for the largest share at 43%, followed by British Columbia at 20%, while around 10% remained uncategorized.
Ontario remains the most popular destination for Express Entry PNP candidates - which isn’t surprising given the appeal of the province to immigrants. BC following as the second most popular choice was also expected. What was interesting is that Alberta netted less than half of the interest (~7%) in the EE PNP than BC did. However, it is important to note that our findings do not account for the interest in Quebec since their immigration is handled completely separately from federal programs.
Additionally, based on the data, we can observe that of the 116 EE PNP cases recorded in 2025, 57% fall under the all-program/general category, while the second largest group (41%) is uncategorized.
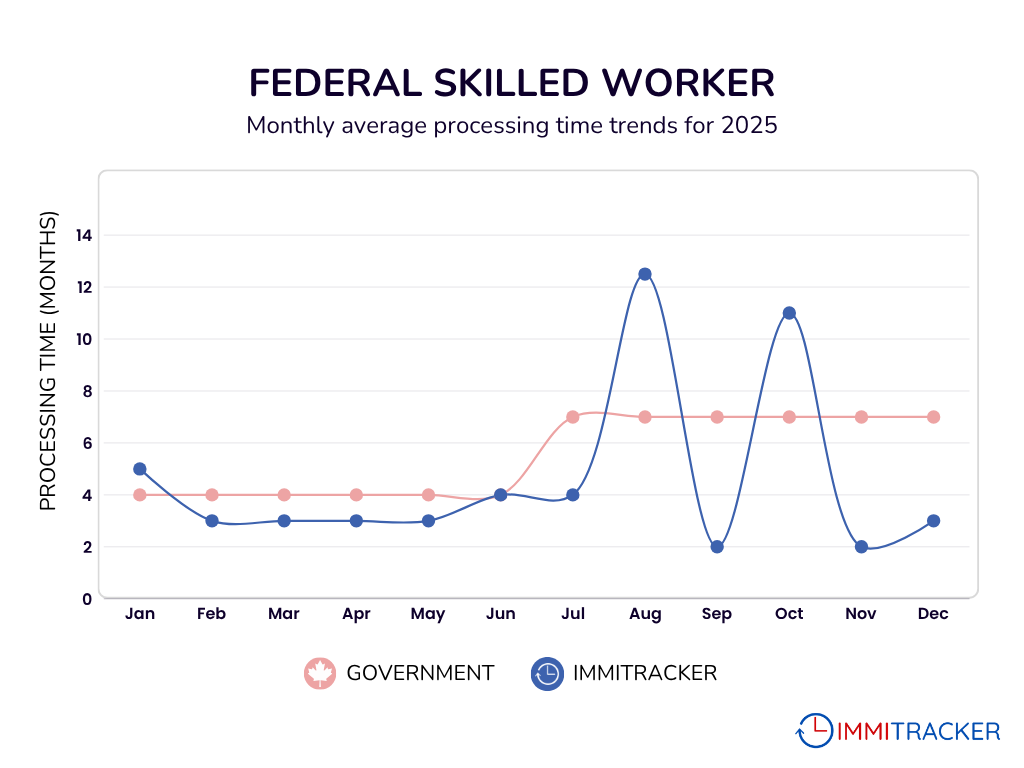
Express Entry Federal Skilled Worker Program (FSW) Program
Although it’s not displayed in this graph, we did notice a reduction in the Federal Skilled Worker cases being tracked on Immitracker during the second half of the year. On average we found that the FSW program took 5 (5.1 to be exact) months in 2025 while IRCC’s estimated average was 5 months as well.
Overall, we observed that cases were processed 1 to 2 months faster than the government’s estimates for most of the year, except for two peaks in August and October.
Disregarding these two months, the data for the first half of the year closely aligned with government estimates. Interestingly, both outlier-driven spikes occurred in the second half of the year, when government processing times had jumped from four months to seven months.
Similar to Express Entry PNP, we analyzed very few cases for FSW during November and December which affected our processing time estimates. It looks like less cases on Immitracker were approved for these programs towards the end of the year.
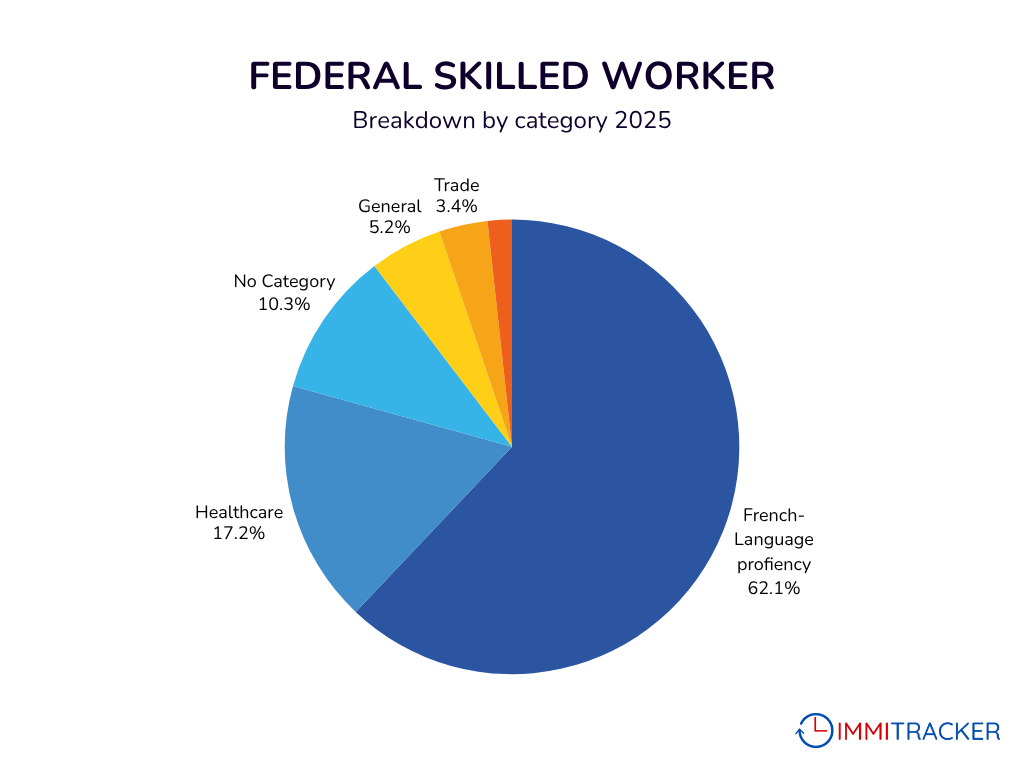
Category Breakdown (for FSW)
42% of ITAs issued by IRCC in 2025 under the FSW program were to candidates in the French-language proficiency category (48K ITAs issued).
62% of FSW cases approved on Immitracker in 2025 were for the French-language proficiency category. Therefore, it did not come as a surprise to us that many of these cases appear often in both the fastest processing time month and the month with the highest volume of case approvals (as described in more detail below).
This trend could hint at the government’s attempts to prioritize francophone immigration across the board: from more applicants being invited to being processed quicker as well.
Slowest FSW Case Processing Time Months: August & October
Figure 2. ITA cohort from which outlier case was found; received approval in August 2025
The August and October processing time peaks seemed uncharacteristic given the program's annual average of five months for 2025. When investigating further as to why, we discovered that two extreme outlier cases occurred in these months.
Interestingly in August, which consisted of four cases, the outlier (1,021 days from China) was part of the all-program/general category, and the ITA date was found to trace back to September 2022 (draw specified in Figure 2 above)! This outlier skewed the average processing time for this month, as the remaining three cases approved were from the French-language category.
A similar phenomenon occurred in October where an extreme outlier impacted the average because there were a small number of cases approved that month. The outlier case of 1,684 days from an Indian national is listed as unnamed/uncategorized.
In conclusion, these two slowest months were the result of extreme outliers skewing the average, rather than cases overall being handled less efficiently.
Fastest FSW Case Processing Time Month: November
Figure 3. ITA cohorts associated with quickest FSW approvals
Another observation that piqued our interest was how fast applicants recorded receiving approval in November and December: 2.3 months. This is the fastest average processing time across the program for the whole year!
When taking a deeper look, we found that this particular time period consisted of French-language and Healthcare applicants entirely. More specifically, these invitees were part of large invitation rounds conducted mostly in August (draws referenced in Figure 3).
Month with highest volume of FSW case approvals: January

Figure 4. ITA Cohort associated with the largest portion of approvals (January 2025)
When looking at the month with the highest volume of approvals, we broke it down by category. January consisted of 10 total cases, 8 of which were from the French-language category. These French-language applicants came from large invitation batches between August and October 2024.
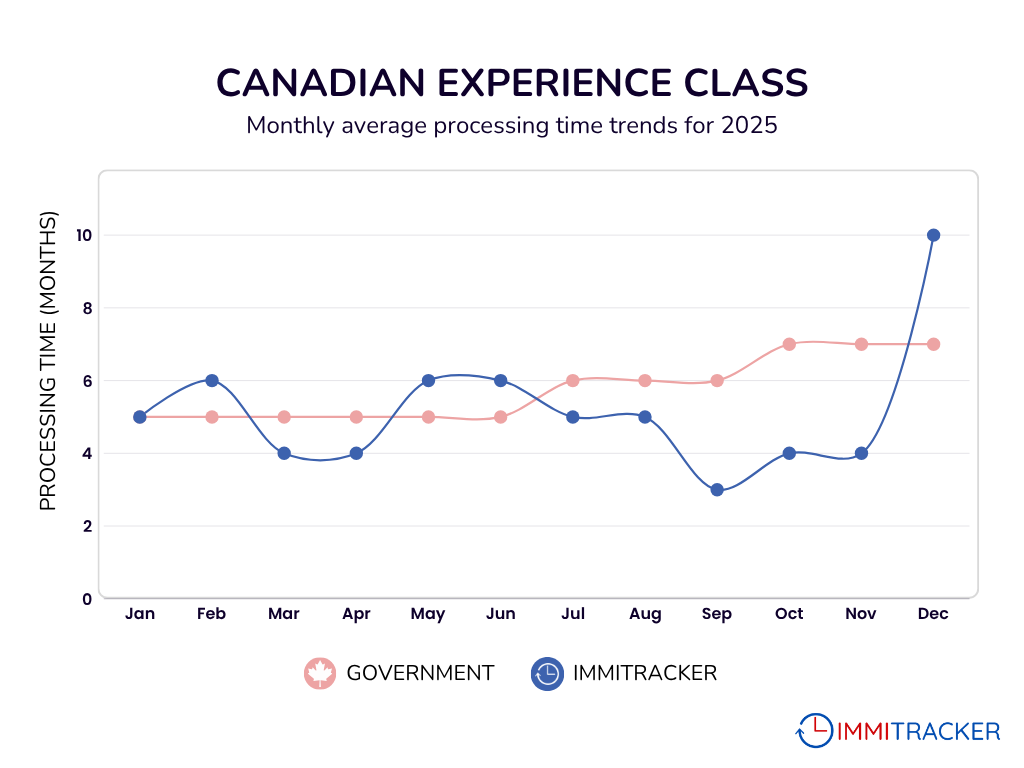
Express Entry Canadian Experience Class (CEC) Program
Overall, for the first half of the year, processing times for the Canadian Experience Class program remained relatively close to government estimates. On average we found that the CEC program took 5 (4.8 to be exact) months in 2025 versus IRCC’s estimated average of 6 months.
However, beginning in July, we noticed a considerable divergence in processing time as government estimates increased to 6 to 7 months while Immitracker data remained generally lower. Despite this, a remarkable spike occurred in December, where processing times jumped abruptly to 10 (9.7 to be exact) months, exceeding the government estimate. This spike might suggest that while most cases were processed slightly faster than expected, outlier cases or extreme backlog can lead to increases in average processing times.
CEC is also following the trend of Express Entry PNP and FSW - we saw significantly less cases during November and December which affected our processing time estimates. It looks like less cases on Immitracker were approved for these programs towards the end of the year.
Slowest CEC Case Processing Time Months: December
Here at Immitracker, we noticed a surprising climb in processing time toward the end of 2025, in December specifically. When investigating this slow down of 10 months, we discovered that of the four cases recorded this month, two were uncategorized, one fell under STEM occupation while the other was under healthcare occupation.
The STEM applicant, whose ITA date aligns with the December 8, 2023 invitation round (highlighted in Figure 5 below), had a considerably longer processing time of 738 days. This likely had a significant impact on the overall average, which contributed to December becoming the slowest month.

Figure 5. ITA cohort from which the STEM applicant was found; received approval in December 2025
Fastest month: September
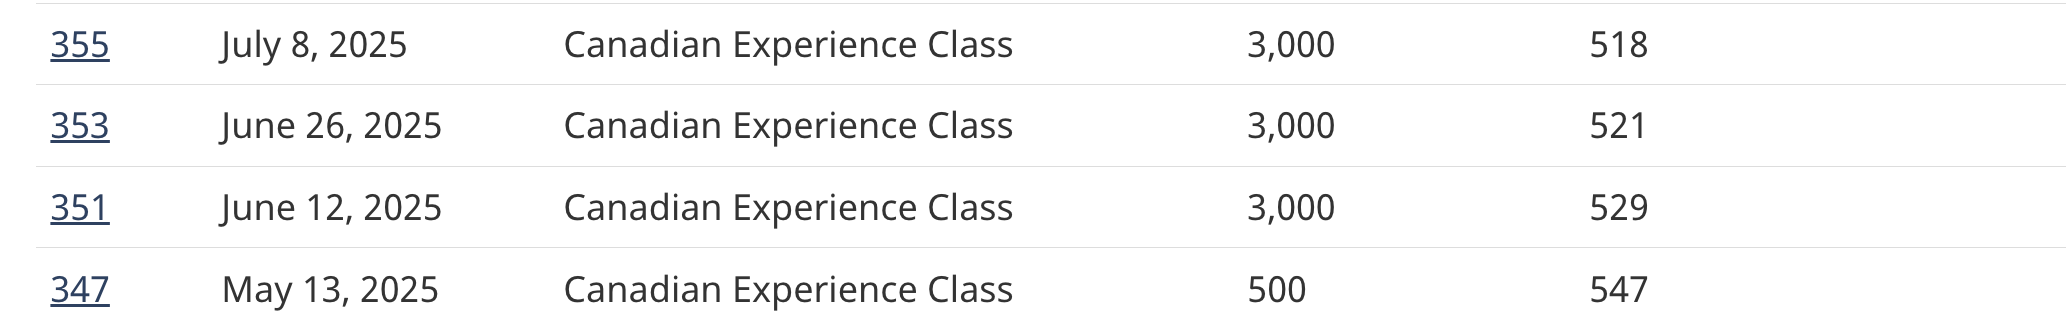
Figure 6. ITA cohort associated with the fastest CEC approvals (September 2025)
With 23 cases recorded in September and an average processing time of 3 (3.2 to be exact) months, we looked further into the underlying cause. Of the 23 cases, seven did not include an ITA date; however, based on the remaining data, we were able to determine that the majority originated from large CEC invitation rounds spanning May to July 2025.
Month with the highest volumes of approvals: January
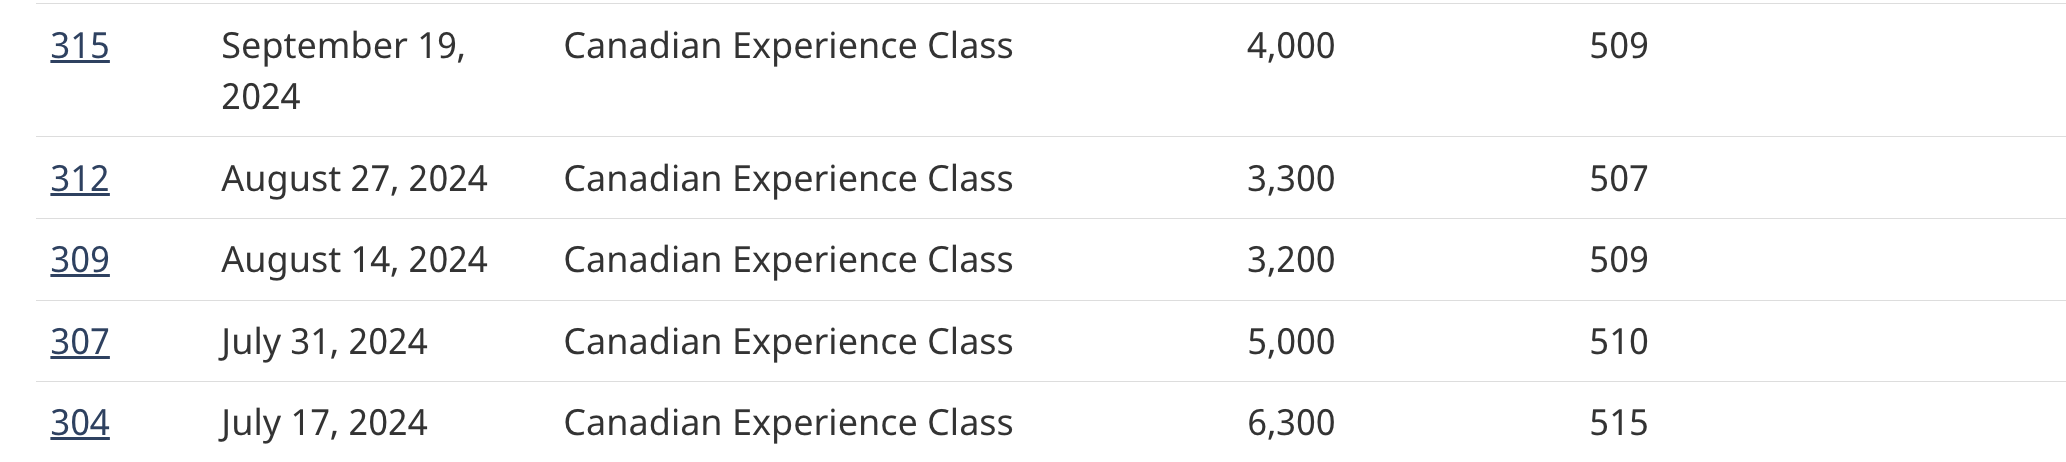
Figure 7. ITA Cohort associated with the largest portion of approvals (January 2025)
With January containing the highest volume of approvals at 76 cases, we broke it down by category to better understand which types of applicants were being prioritized. Of the 76 cases, 46 (61%) fell under the all-program/general categories. This large cohort appears to consist mainly of applicants from the July to September 2024 invitation rounds (referenced in Figure 7). Based on the average processing time of roughly 5 months, this aligns closely with cases being approved in January 2025.
Additional Insights
The Immitracker Work Permit tracker was launched late in 2023, and as a result, the number of cases recorded throughout 2025 remains relatively limited. This puts a restriction on our ability to make solid comparisons with IRCC estimates or make conclusions about overall processing trends.
Despite this, we mapped out monthly processing times to identify any general patterns. Overall, processing times have little variability throughout the year, typically ranging between 4 to 6 months. Unlike other programs, there were no sudden spikes or sharp declines, this hints at a more consistent processing pattern.
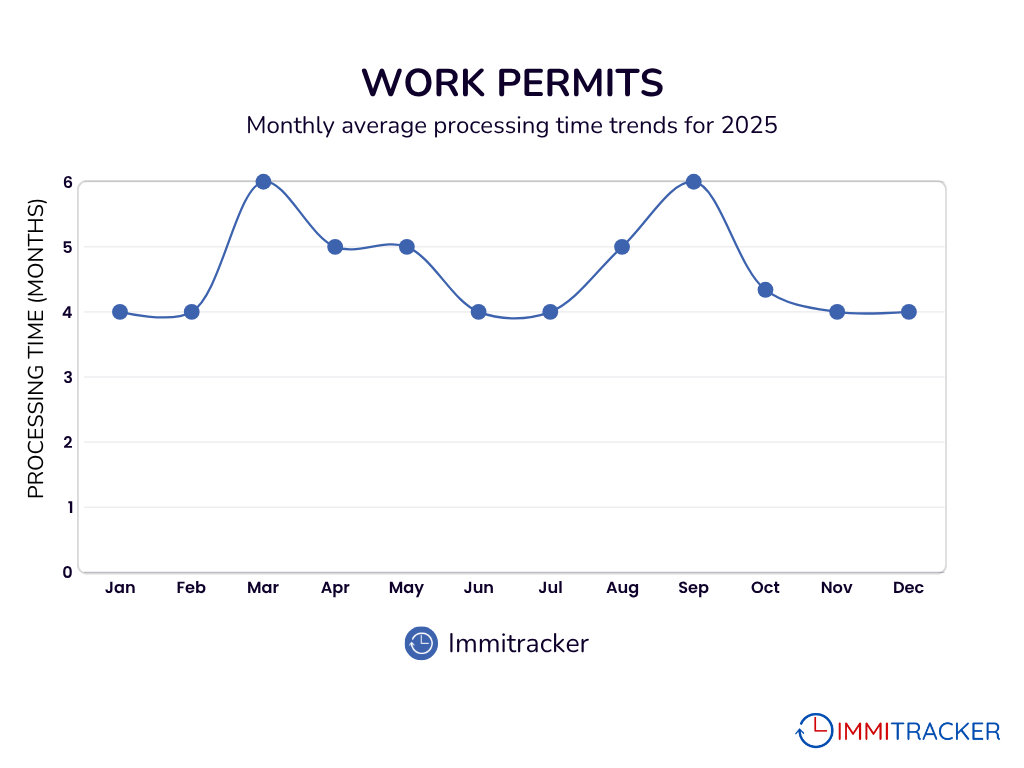
Work Permits
Additionally, we broke the Work Permit cases into categories. With 50 total recorded cases for 2025, we found that both Spousal Work and Closed Work permits were the dominant types, both categories made up around 35% each of total permits. We also found that there were 0 cases tracked for the Startup Visa work permit category.
The relatively low number of reported cases may reflect lower application volumes or reduced participation in tracking from users, which could point to broader trends in work permit demand or intake. However, further data would be needed to confirm this observation.
If you’re interested in getting a copy of our data analysis summaries, you can download them along with the infographic for free at the following link!
Looking for processing time insights for other programs? Check out the Immitracker trackers or reach out to us through our Contact Form and we can help you find the answers!